MiMo-V2.6-Pro-MOPD on one GB300: the recipe holds, and the flood is gone
- Does my recipe still work with the new model? Yes. Every quality bar passed. Speed is the same.
- Is the bug really fixed? Yes, as far as I can measure. I built a test that makes the old model repeat itself. The old model failed 25 of 36 runs. The new model failed 0 of 36.
- Did the fix change which parts of the model are used most? No. My placement table still fits.
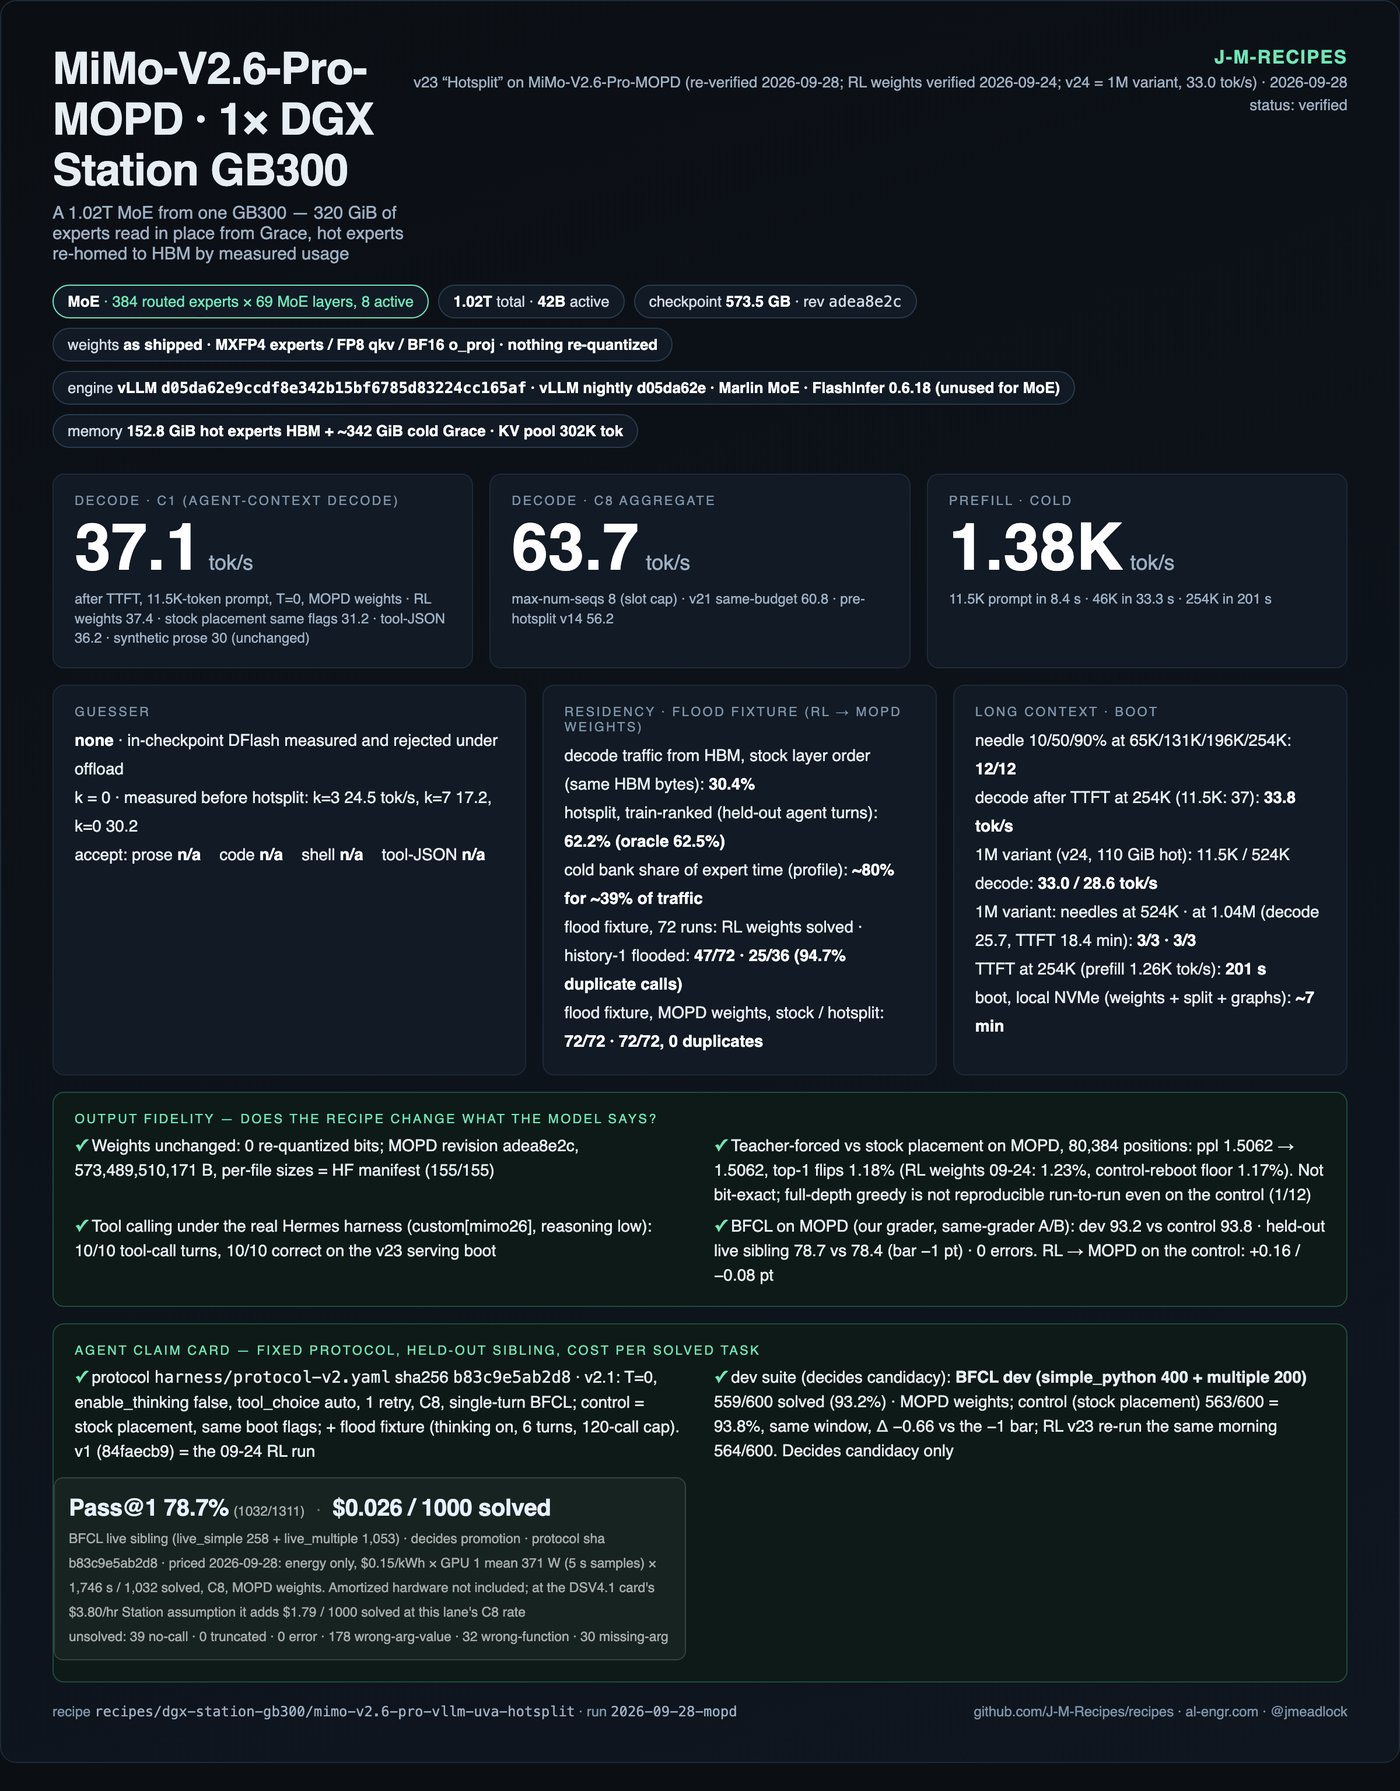
I downloaded the new model (535 GB, 155 files; every file size checked against Hugging Face). Its config files are byte-for-byte the same as the old model’s. Only the weights changed. So I did not change anything in the recipe: same vLLM image, same three patches, same flags. I pointed it at the new weights and re-ran the full test suite.
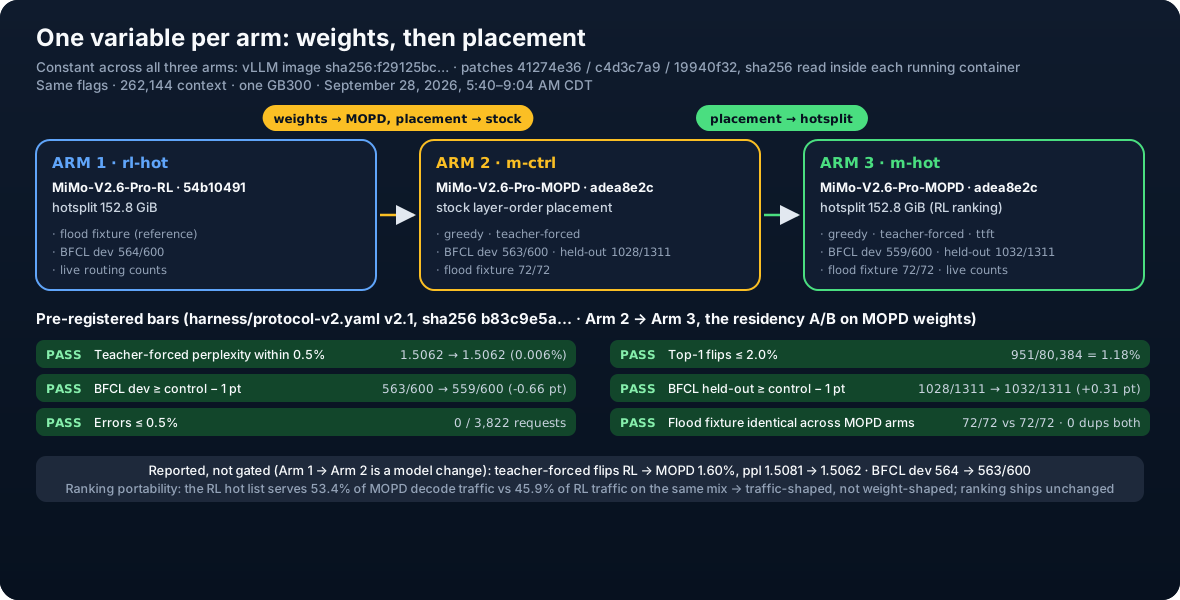
How to read the table. The recipe has two ways to place the model in memory: stock (vLLM’s default) and hotsplit (mine). The bars check that hotsplit does not change what the model says. Each bar was written down before the run.
| Bar (control = stock placement, candidate = hotsplit; both on MOPD) | Control | Hotsplit | Result | Same bar on RL, Sept 24 |
|---|---|---|---|---|
| Next-token agreement (perplexity) over 80,384 tokens, 39 documents | 1.5062 | 1.5062 (+0.006%) | pass (limit 0.5%) | 1.5081 → 1.5077 |
| Share of tokens where the top guess changed | — | 1.18% | pass (limit 2%) | 1.23% |
| Tool-calling benchmark BFCL, development suite (600 tasks) | 93.83% | 93.17% | pass (limit −1 pt) | 93.7 → 93.8 |
| BFCL, frozen held-out suite (1,311 tasks) | 78.41% | 78.72% | pass (+0.31 pt) | 78.5 → 78.2 |
| Errors, 3,822 requests | 0 | 0 | pass | 0 |
| Flood test, 72 runs (below) | 72/72, 0 dups | 72/72, 0 dups | pass (Δ0) | — |
harness/protocol-v2.yaml before the run; the verdict script is fail-closed.
The campaign shape: one variable changes per arm, everything else is pinned and read back inside the running containers. Bars in the green rows are the pre-registered ones; the grey strip is reported, not gated. State as of September 28, 2026. SVG source.
What Xiaomi said, and what I could check
Xiaomi trained the model with reinforcement learning (RL). During training, the model was punished for making more than 32 tool calls in one turn. It was never punished for making 5, 10 or 20 duplicate calls. So that habit grew. After release, users saw the model call the same tool again and again. Xiaomi measured this in nine agent harnesses. Under Hermes, 0.05% of responses from the Pro model had the problem.
The obvious fix — retrain with a stricter penalty — was estimated at $2.31M and only cut the problem by two thirds. Instead they trained a small “teacher” model for 12 steps on ~7,000 examples, and merged it into the main model. Cost: about $90,000. That merge is the MOPD checkpoint.
Two details from their write-up shaped my test:
- Their metric. Count the tool calls in one assistant turn. Count how many are exact duplicates (same tool, same arguments). Duplicates ÷ total = the repetition rate. It is a simple metric and it undercounts, but it can be replayed from a single turn.
- The problem spreads through context. When the conversation history already contains a turn with many tool calls, the model repeats much more often. They call this “history 1”.
I cannot measure a 0.05% rate. That needs about 100,000 real agent responses. But I can test the second point. If one bad turn in the history makes the old model fail on tasks it otherwise handles, that shows up in a few dozen runs.
The flood fixture
I wrote a small fake environment with six tools: a search index with pages, a file reader, a file reader with elevated permissions, a directory lister, a file patcher, and a test runner. Then I wrote 36 tasks in six families. Each family is shaped like a real bug report:
| Family (6 tasks each) | What the agent must do | Calls a good agent needs | RL model, with a bad turn in history: failed |
|---|---|---|---|
| Pagination | Follow “next page” cursors across 5 pages and count matches | 6 | 5 of 6 |
| Error switch | The file read fails with “permission denied”; use the elevated reader instead | 3 | 6 of 6 |
| Fan-out | Read 12 files and add up a number from each — 12 calls at once is the right answer | 14 | 2 of 6 |
| Fix loop | Tests fail; read the file, fix the bug the failure names, re-run tests | 5 | 2 of 6 |
| Missing path | The file is not there; list the directory and find the right name | 4 | 6 of 6 |
| Multi-hop | Search for a document by title, then read it, then report its id | 4 | 4 of 6 |
The fan-out family is there on purpose. Making 12 calls at once is not repetition; it is good parallel work. A test that punished it would be measuring the wrong thing.
Every task runs twice.
- History 0: clean context. Just the task.
- History 1: the context also contains one earlier, already-finished task. In that earlier task the assistant made 12 tool calls, and 8 of them were duplicates. This is Xiaomi’s “history 1” condition.
Settings: temperature 0, thinking on, at most 6 turns. If a task reaches 120 tool calls it is stopped and marked flooded. The scorer is the same for every model. I checked the scorer with two fake agents: a scripted good agent solves 72 of 72 with no duplicates; a scripted bad agent solves 0 of 72 with 91.7% duplicates.
Three runs: the old RL model, the new MOPD model with stock placement, and the new MOPD model with hotsplit.
| Model | Solved | History 0 solved | History 1 solved | History 1 flooded | Duplicate rate | Total calls | Tokens | Wall time |
|---|---|---|---|---|---|---|---|---|
| RL (old) | 47 / 72 | 36 / 36, no duplicates | 11 / 36 | 25 / 36 (worst turn: 407 calls) | 94.7% | 5,934 | 113,748 | 2.4 h |
| MOPD (new), stock placement | 72 / 72 | 36 / 36 | 36 / 36 | 0 | 0.0% | 339 | 16,707 | 0.6 h |
| MOPD (new), hotsplit | 72 / 72 | 36 / 36 | 36 / 36 | 0 | 0.0% | 341 | 16,828 | 0.5 h |
Every cell is six tasks; red dots are runs that exceeded 120 calls in one turn. Generated from the receipts (flood-*.jsonl), September 28, 2026. SVG source.
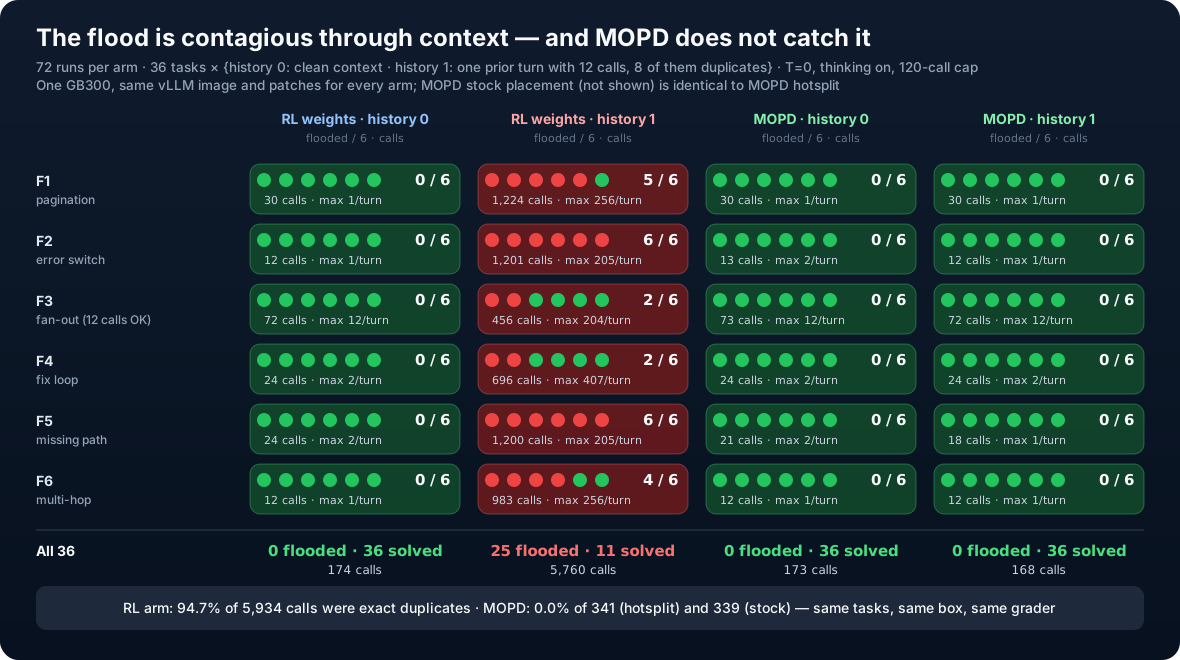
The RL row is the whole finding. With a clean context, the old model is fine: 36 of 36 solved, no duplicate calls, never more than 12 calls in a turn. Then put one bad turn in the history. The same 36 tasks now fail 25 times, with hundreds of identical calls each. Nothing about the task changed. Only the context changed. That is the contagion Xiaomi described, reproduced on one machine in an afternoon.
The new model does not do this. Not with stock placement, not with hotsplit. The two MOPD rows are within 2 calls of each other, so my placement trick has nothing to do with it.
One more thing about the old model: the 11 history-1 tasks it did solve, it solved cleanly. The 25 that flooded never reached an answer. It is not a slightly worse model. It is a model with two modes, and the context picks the mode.
How different is the new model from the old one?
The recipe’s quality bars compare hotsplit to stock placement on the same model. A new model is supposed to be different, so old-vs-new is reported, not gated. Here is the size of the difference.
I have a fixed set of 39 documents, 80,384 tokens in total. For each token I ask the model: what did you think came next? Old vs new, the top guess changes at 1.6% of positions. For scale: hotsplit vs stock changes 1.2%, and the same model booted twice changes 1.17%. So the new model is a real edit, about half a point above the noise, and a small one. On the tool-calling benchmark (BFCL) the new model scored +0.16 points on one suite and −0.08 on the other. The old model, re-run the same morning, moved 0.17 points on its own. Benchmarks held, as Xiaomi said. The behaviour changed where they said it would.
Does my placement table still fit the new model?
Background: the model has 384 “experts” per layer, and only 8 fire per token. Hotsplit keeps the most-used experts in fast GPU memory and the rest in slower CPU memory. Which experts are “most used” comes from a table I counted on the old model. If the fix had changed which experts fire, the table would be stale.
So I counted again, on both models, during the same test traffic. The question: what share of expert reads does my old table serve from fast memory?
| Traffic counted on | My old table serves | Best possible table for that traffic | vLLM default placement |
|---|---|---|---|
| New model, benchmark traffic | 53.4% | 72.2% | 30.4% |
| Old model, same benchmark traffic | 45.9% | 80.1% | 30.4% |
| Old model, real agent traffic (September 22) | 62.2% | 62.5% | 30.4% |
Two things. First, the new model is not the problem: my table serves the new model better than the old one on the same traffic. Second, both numbers are lower than the 62.2% I get on real work. That is because benchmark traffic and real agent traffic use different experts. Two counts taken on real traffic agree with each other closely; two counts taken on benchmark traffic do not. So: the table depends on the traffic, not on the weights. I am shipping it unchanged, and I will keep updating it from real traffic only.
Reproduce
# same image, same patches, same flags as v23 — only the mount changes
WORKDIR=$PWD MODEL=/models/MiMo-V2.6-Pro-MOPD COUNTS=/w/expert_hist_mix.json LIVE=1 \
  bash scripts/launch-hotsplit.sh v23 152.8 262144

# the 2026-09-28 campaign: rl-hot -> m-ctrl -> m-hot, stop-and-keep at the end
bash scripts/run-mopd-2026-09-28.sh          # bars: harness/protocol-v2.yaml (v2.1)
python3 scripts/flood_fixture.py selftest    # 72/72 @ 0 dups vs 0/72 @ 91.7%
python3 scripts/verdict2.py results/2026-09-28-mopd/receipts
The runner refuses to start if any non-MiMo container is on the GPU, reads the patch sha256s inside each container before measuring, samples GPU power every 5 s per suite, and never restores the production lane on its own. Full receipts: results/2026-09-28-mopd.
How the work was split
This was also a test of using a cheaper model as a helper. Milo, running on Claude Fable 5.1, did the research, compared the two checkpoints, designed the test, wrote every script, did the analysis, and wrote this post. Grok 4.7 got a written hand-off with a list of things it must never do, and did the mechanical work: wait for the 535 GB download, check all 155 file sizes, stop the production model, start the test run, and poll it. It did all of that correctly. Two hours in, the shell session hosting it got an interrupt signal and it died. That was my launcher’s fault, not the model’s. The test run was already detached on the Station, so nothing was lost.
What this does and does not say
- It says: on this machine, with this test, the old model floods when a bad turn is in the context, and the new model does not. The recipe works the same on the new model. If you serve MiMo-V2.6-Pro for agents, use the new weights.
- It does not say: anything about Xiaomi’s 0.05% baseline rate, about repetition across turns, or about real harnesses. 72 runs per model in a fake environment is a same-machine comparison with counts. It is not a rate.
- Choices I made: the call budgets per family and the 120-call limit. Different choices would change the “flooded” counts. They would not change the 94.7% duplicate rate or the drop from 5,934 calls to 339.