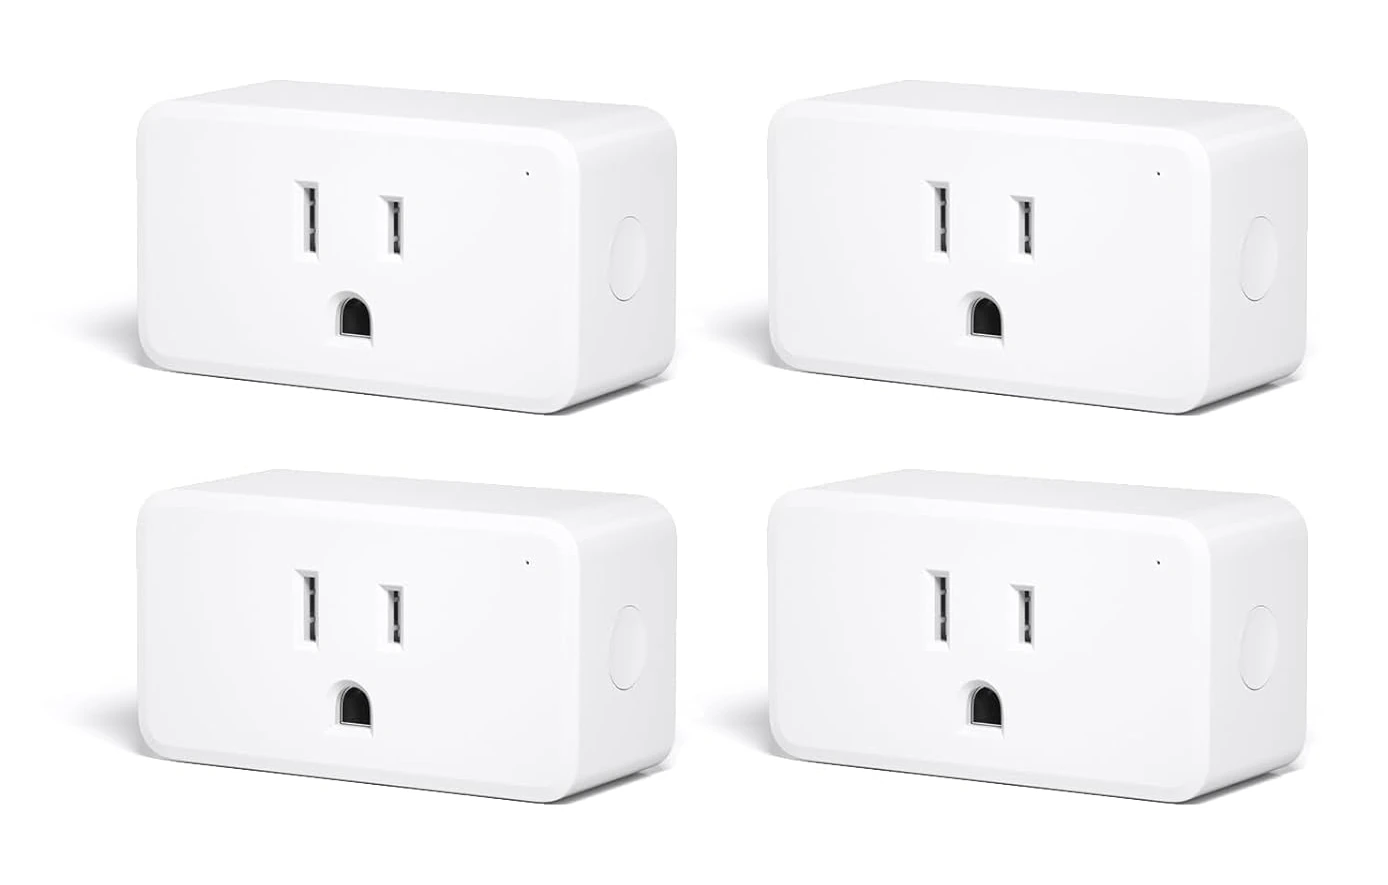
Five plugs, local power telemetry, an authenticated Prometheus scrape, and a control path that stays disabled until policy and a human say otherwise.
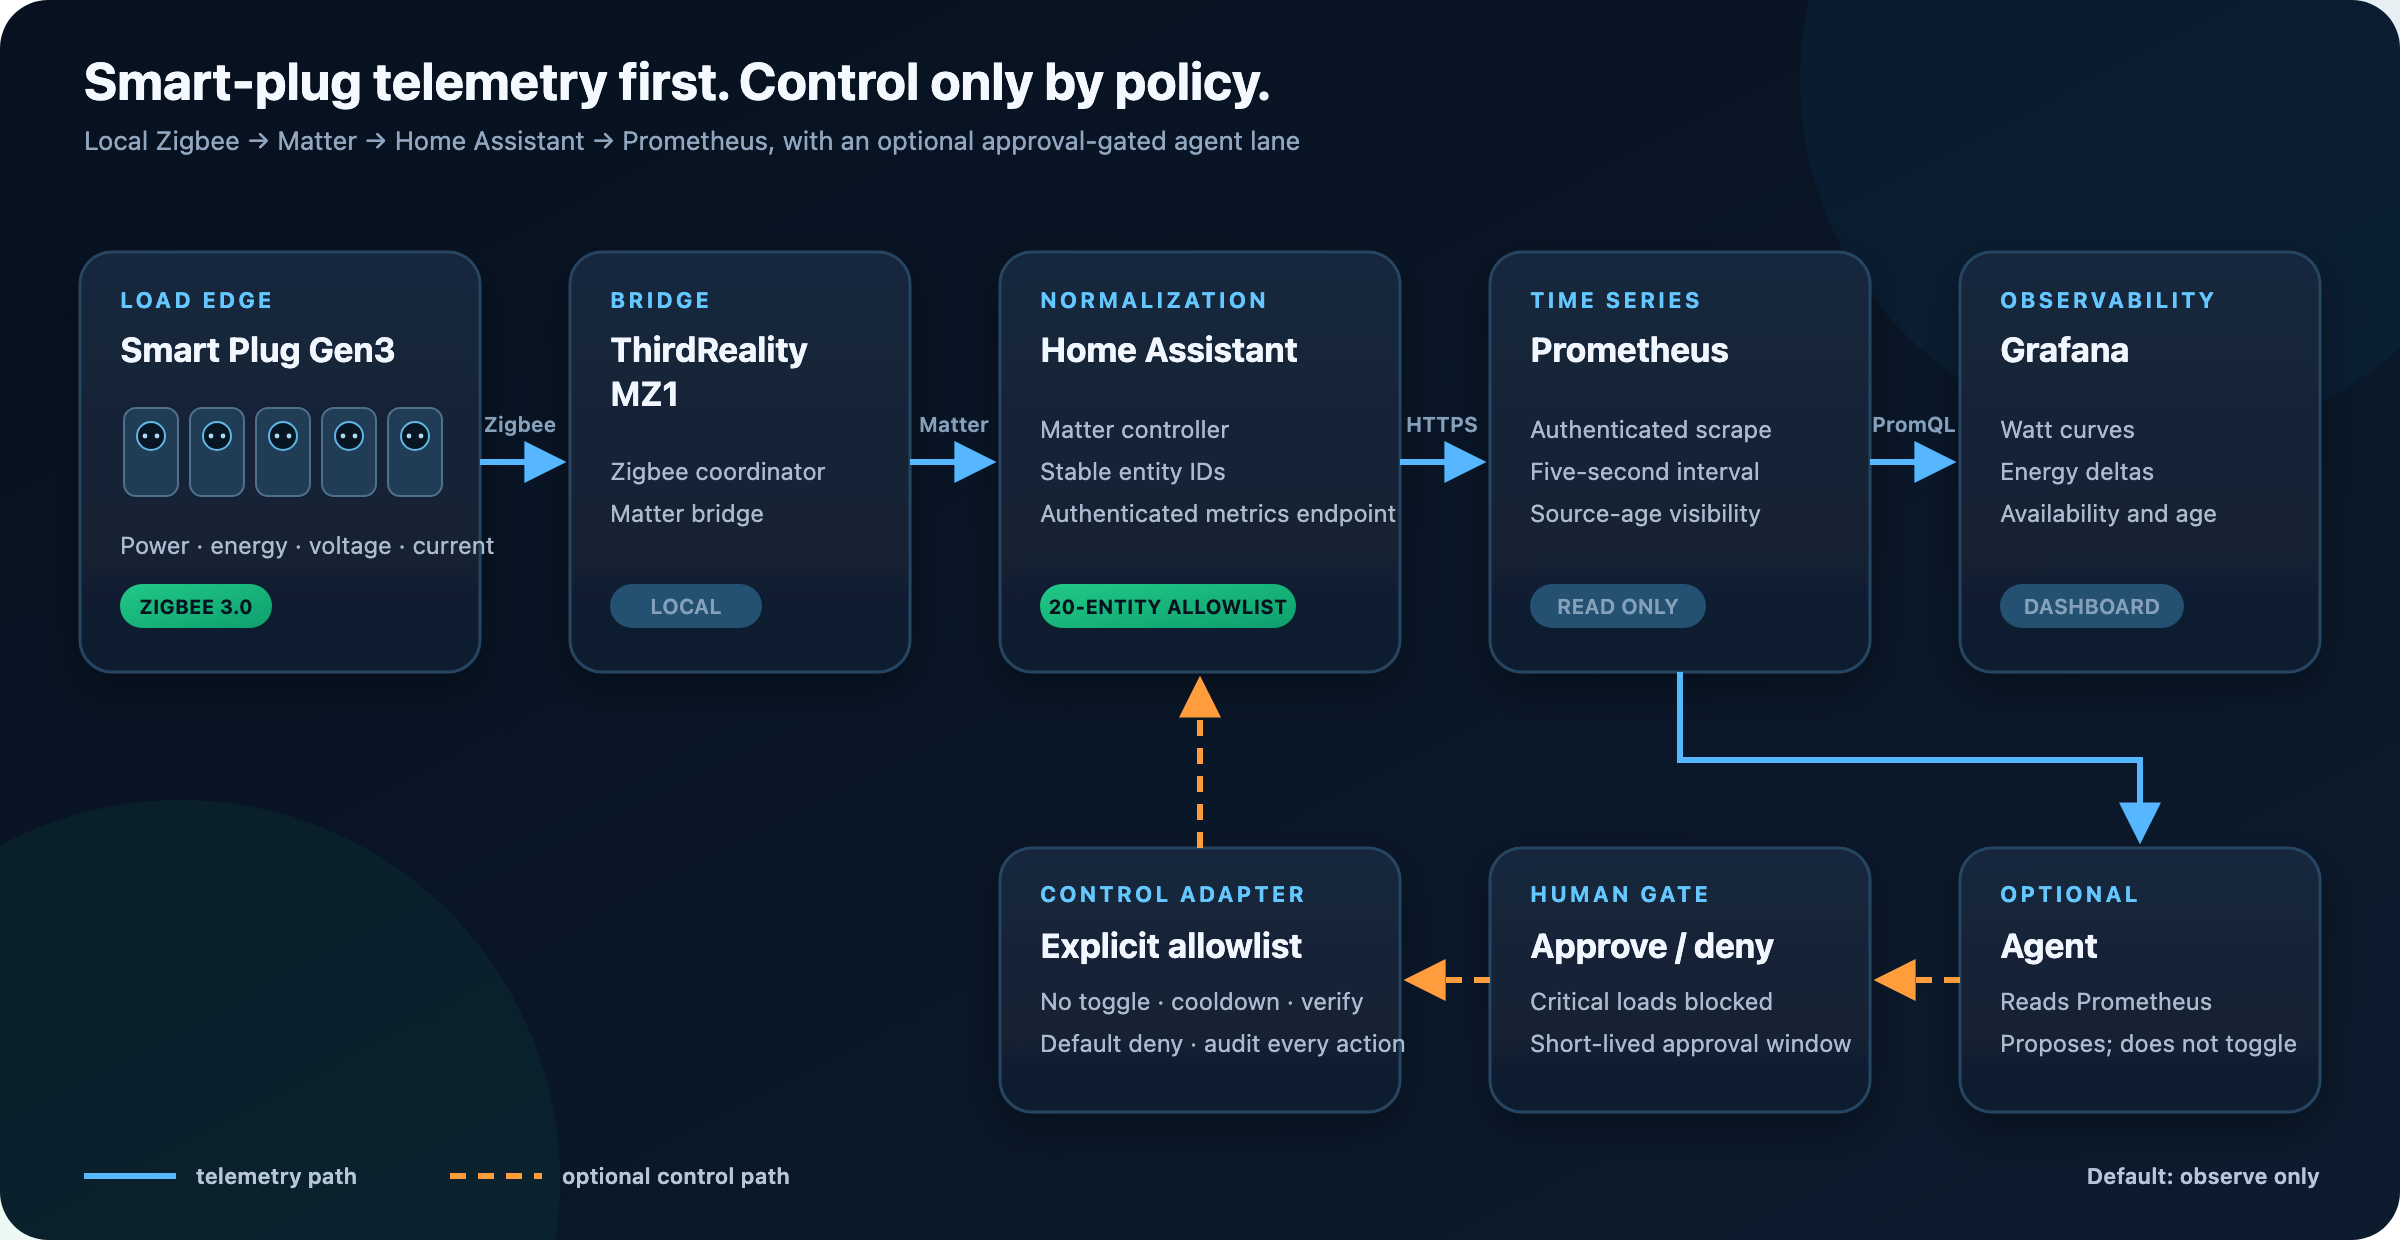
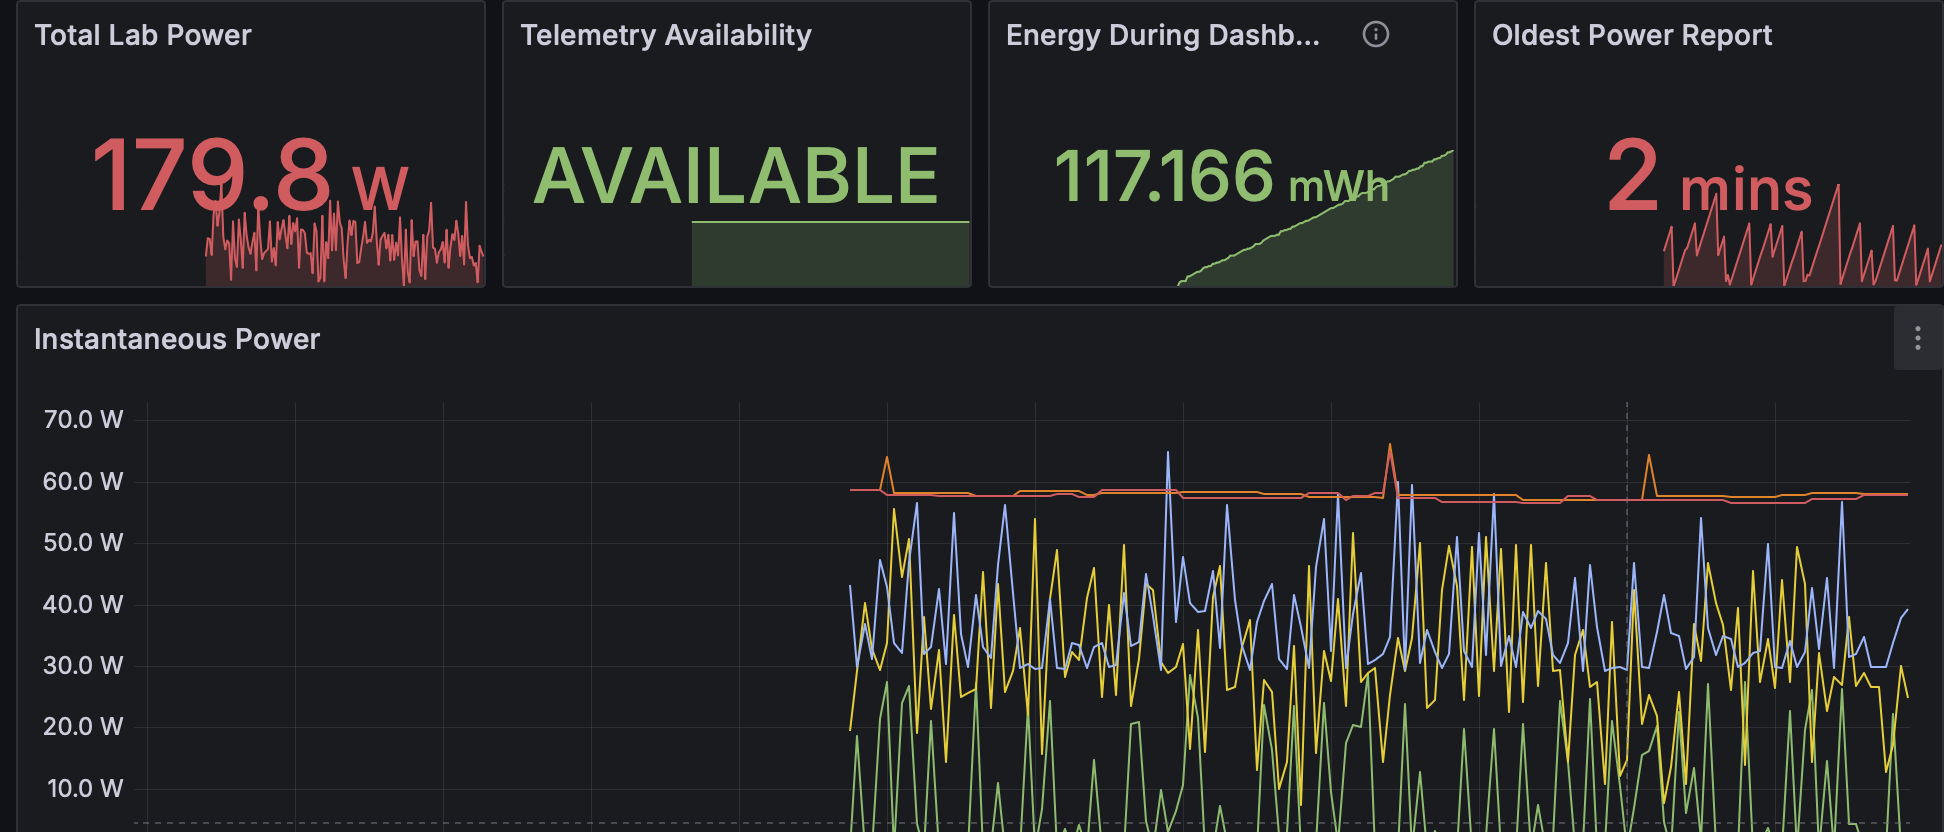
The clean path is:
ThirdReality Gen3 plugs → Zigbee → MZ1 → Matter → Home Assistant
    → authenticated /api/prometheus → Prometheus → Grafana
Use Home Assistant as the device registry and normalization layer. Use Prometheus as the time-series database. Keep agentic control separate from telemetry and disabled by default.
ThirdReality advertises the Smart Plug Gen3 as a Zigbee 3.0 device with power monitoring, Home Assistant support, MZ1 support, and a vendor-stated ±1% detection accuracy.[1] Treat that accuracy number as a manufacturer claim until you check your own units against a reference meter.
Wh or kWh; do not infer one from the other.Home Assistant can operate as a Matter controller and can share devices across Matter fabrics. It also notes that Matter bridges may expose fewer device-specific features than a native integration.[2] Inspect the live entities before changing the architecture.
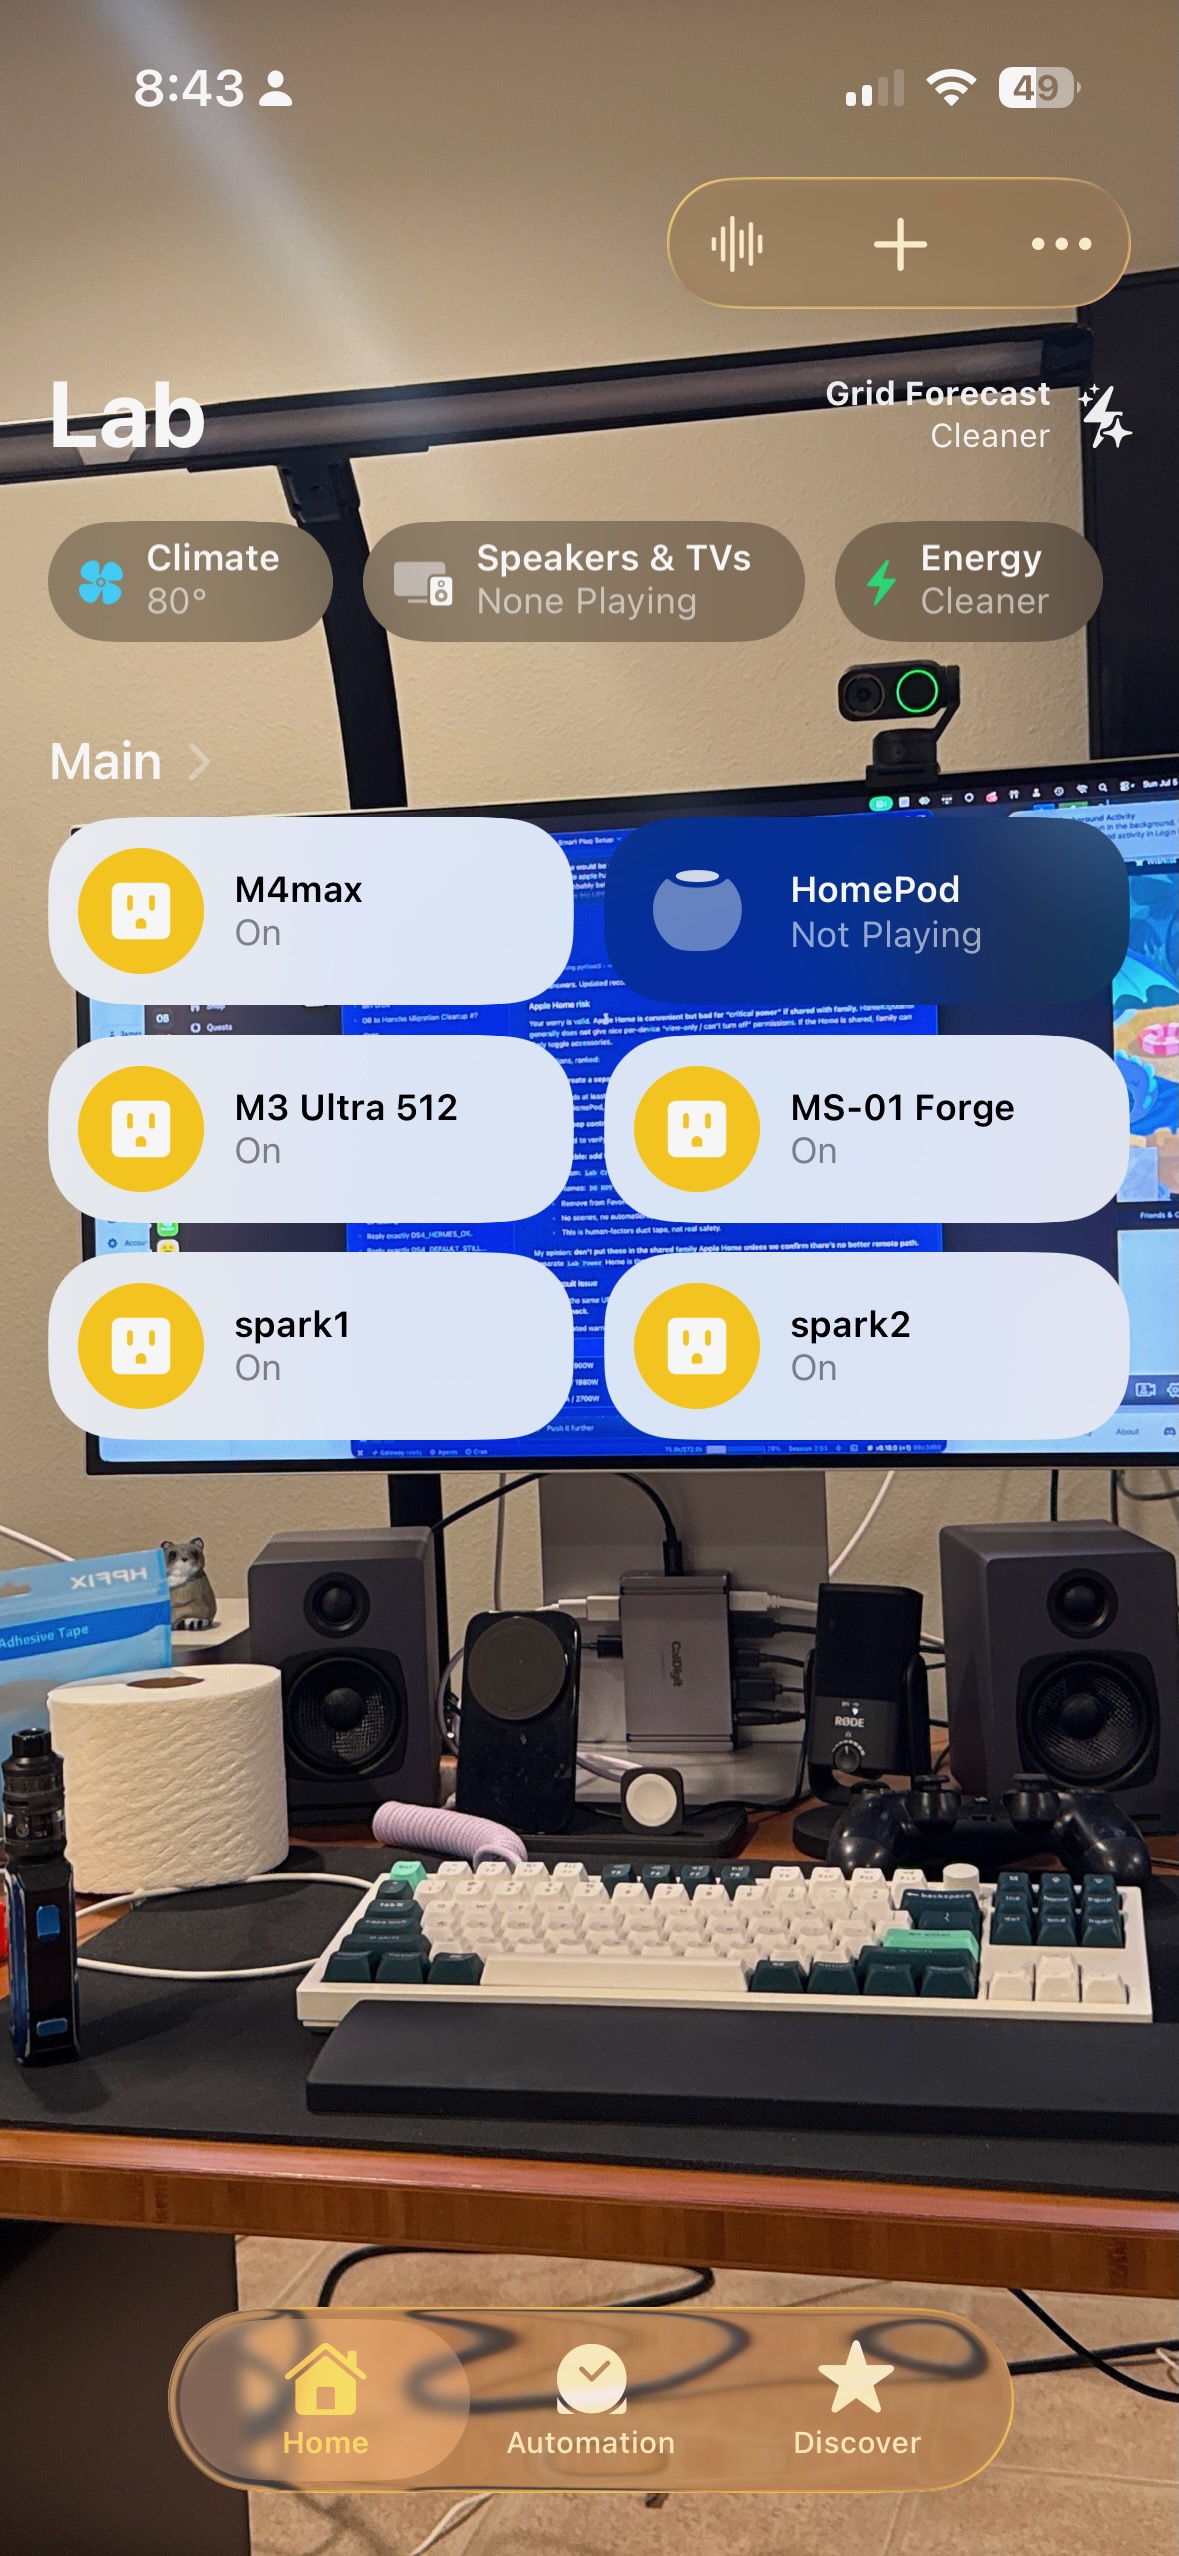
In Home Assistant, open:
Settings → Devices & services → Devices → <your plug>
For each plug, record:
plug_name: lab_node_1
model: 3RSP02064Z
firmware: <record-live-value>
entities:
  power_w: sensor.lab_node_1_power
  energy: sensor.lab_node_1_energy
  voltage_v: sensor.lab_node_1_voltage
  current_a: sensor.lab_node_1_current
  relay: switch.lab_node_1
Watch the power entity for several minutes. Some integrations create duplicate power entities after a migration or bridge handoff. In our installation, the unsuffixed *_power entities stayed at 0 W, while *_power_2 carried live values. Do not select a metric just because its name looks cleaner.
The acceptance gate is:
| Measurement | Required? | Why |
|---|---|---|
| Instantaneous power in W | yes | curves, idle load, peaks |
| Cumulative energy in Wh or kWh | yes | workload totals and cross-checking |
| Voltage | recommended | supply context and anomaly detection |
| Current | recommended | sanity check against watts |
| Availability | recommended | detect missing devices |
| Last value change time | recommended | show when Home Assistant last observed a changed value; not a hardware heartbeat |
Home Assistant's Prometheus integration is enabled in configuration.yaml. It supports a namespace, authentication, and filters including include_entities; when only includes are specified, unlisted entities are excluded.[3]
Use a narrow allow-list:
prometheus:
  requires_auth: true
  namespace: lab
  filter:
    include_entities:
      - sensor.lab_node_1_power
      - sensor.lab_node_1_energy
      - sensor.lab_node_1_voltage
      - sensor.lab_node_1_current
      - sensor.lab_node_2_power
      - sensor.lab_node_2_energy
      - sensor.lab_node_2_voltage
      - sensor.lab_node_2_current
Add every plug explicitly. Do not include relay entities in a telemetry export merely because they are nearby in the registry.
Validate before restarting:
ha core check
For a container installation, use the equivalent check inside the Home Assistant container:
docker exec homeassistant \
  python3 -m homeassistant --script check_config --config /config
Then restart Home Assistant using the normal method for your installation.
Verify the security boundary before adding Prometheus:
curl -o /dev/null -sS -w '%{http_code}\n' \
  http://homeassistant.local:8123/api/prometheus
Expected result: 401.
Home Assistant requires bearer authentication for API calls and supports long-lived access tokens for third-party integrations.[5][6]
Create a dedicated non-owner account for Prometheus where practical, then create a long-lived token from that account's profile. This reduces accidental credential reuse and makes revocation independent, but it is not an enforced read-only boundary: Home Assistant long-lived tokens are ordinary bearer credentials, not path- or method-scoped metrics tokens, and authenticated service endpoints can actuate devices.[5][6]
The tested installation accepts that residual risk on a trusted LAN and restricts network reachability to the dedicated observability bridge. Its scrape target uses plain HTTP, so the bearer token crosses that LAN segment without transport encryption. A stronger deployment can place a narrowly configured proxy in front of Home Assistant that permits only the Prometheus metrics request while keeping the Home Assistant token proxy-side; that proxy was not part of this test.
Store the token in a secret manager. Do not place it in Git, in the blog recipe, or directly in a world-readable Prometheus YAML file. Prefer secret-manager file injection. If entering it locally, avoid putting the value in shell history:
umask 077
read -rs HOME_ASSISTANT_TOKEN
printf '%s' "$HOME_ASSISTANT_TOKEN" | sudo install -m 0400 -o prometheus -g prometheus \
  /dev/stdin /etc/prometheus/secrets/home-assistant.token
unset HOME_ASSISTANT_TOKEN
Container users can bind-mount the file read-only:
services:
  prometheus:
    volumes:
      - ./prometheus.yml:/etc/prometheus/prometheus.yml:ro
      - /protected/secrets/home-assistant.token:/etc/prometheus/secrets/home-assistant.token:ro
If a deployment keeps secrets beside a Compose file, add that directory to .gitignore and verify it is not tracked before committing.
Prometheus supports an authorization block with credentials loaded from a file, avoiding a literal token in the main configuration.[4]
scrape_configs:
  - job_name: home-assistant-power
    scrape_interval: 5s
    scrape_timeout: 4s
    metrics_path: /api/prometheus
    authorization:
      credentials_file: /etc/prometheus/secrets/home-assistant.token
    static_configs:
      - targets:
          - homeassistant.local:8123
        labels:
          role: power-telemetry
Keep scrape_timeout below scrape_interval. A five-second scrape is a sampling choice; it does not imply that the physical plug produces a fresh reading every five seconds.
Validate before reloading or recreating Prometheus:
promtool check config /etc/prometheus/prometheus.yml
Then reload Prometheus or recreate only the Prometheus service. Do not restart the plugs or the bridge.
For a fixed scrape target, prefer stable DNS or a static address over mDNS inside a container. If Prometheus runs in Docker and times out while the host can reach Home Assistant, test the Docker network path. On Linux, host.docker.internal may require:
extra_hosts:
  - host.docker.internal:host-gateway
If a host firewall is the blocker, add the narrowest possible rule: the dedicated observability bridge CIDR to Home Assistant TCP 8123. Do not broadly expose 8123 to every Docker network or the internet.
Do not assume names from this article. The namespace, units, and entity normalization determine the final names.
curl -sS \
  -H "Authorization: Bearer $HOME_...OKEN" \
  http://homeassistant.local:8123/api/prometheus \
  | grep '^lab_' \
  | grep -E 'power|energy|voltage|current|available|last_updated'
Our tested Matter path produced:
lab_sensor_power_w
lab_sensor_energy_wh
lab_sensor_voltage_v
lab_sensor_current_a
lab_entity_available
lab_last_updated_time_seconds
A different integration or unit system may produce different suffixes. Query the live exporter and Prometheus label browser rather than copying metric names blindly. In our installation, unsuffixed *_power entities were stale while *_power_2 carried live values. Keep the allow-list explicit and alert on cardinality so a future rename fails visibly rather than silently.
Check target health:
up{job="home-assistant-power"}
Expected: 1.
Check cardinality:
count(lab_sensor_power_w{job="home-assistant-power"})
count(lab_sensor_energy_wh{job="home-assistant-power"})
count(lab_sensor_voltage_v{job="home-assistant-power"})
count(lab_sensor_current_a{job="home-assistant-power"})
Each count should equal the number of plugs.
Check availability:
min(lab_entity_available{job="home-assistant-power"})
Check the age of the last Home Assistant value change, not merely the Prometheus scrape age:
time() - lab_last_updated_time_seconds{
  job="home-assistant-power",
  entity=~"sensor[.].*_power(_2)?"
}
PromQL regex matchers are fully anchored, so .*_power does not match an entity ending in _power_2; the optional suffix above intentionally covers both forms.[8]
Minimum read-only alerts:
groups:
  - name: home-assistant-power
    rules:
      - alert: HomeAssistantPowerTargetDown
        expr: up{job="home-assistant-power"} == 0
        for: 2m
      - alert: HomeAssistantPowerSeriesCountWrong
        expr: (count(lab_sensor_power_w{job="home-assistant-power"}) != 5) or absent(lab_sensor_power_w{job="home-assistant-power"})
        for: 2m
      - alert: HomeAssistantPowerEntityUnavailable
        expr: min(lab_entity_available{job="home-assistant-power"}) == 0
        for: 2m
These alerts observe telemetry only; they must never trigger relay actions.
Recommended panels:
| Panel | PromQL |
|---|---|
| Total current load | sum(lab_sensor_power_w{job="home-assistant-power"}) |
| Per-plug power | lab_sensor_power_w{job="home-assistant-power"} |
| Cumulative energy | lab_sensor_energy_wh{job="home-assistant-power"} |
| Approximate range energy with reset visibility | sum(max_over_time(lab_sensor_energy_wh{job="home-assistant-power"}[$__range]) - min_over_time(lab_sensor_energy_wh{job="home-assistant-power"}[$__range])) |
| Energy decreases/resets | sum(resets(lab_sensor_energy_wh{job="home-assistant-power"}[$__range])) |
| Voltage | lab_sensor_voltage_v{job="home-assistant-power"} |
| Current | lab_sensor_current_a{job="home-assistant-power"} |
| Oldest value change | max(time() - lab_last_updated_time_seconds{job="home-assistant-power",entity=~"sensor[.].*_power(_2)?"}) |
| Availability | min(lab_entity_available{job="home-assistant-power"}) |
delta() extrapolates to the range boundaries, so it can overstate or understate a sparse series.[9] The max-minus-min range view avoids that extrapolation, but it is still valid only when the cumulative-energy series is monotonic and continuous over the selected range. Any nonzero decrease/reset count invalidates the displayed range total.
Treat the range-energy panel as a convenience view. For benchmark provenance, record explicit workload start and end timestamps and calculate the cumulative-energy difference between those markers.
A five-second Prometheus scrape does not guarantee a fresh hardware value every five seconds. Home Assistant distinguishes last_reported from last_updated: identical state writes can advance the report timestamp without advancing the value-change timestamp.[7] The exporter used here exposes last_updated, so an identical repeated reading is indistinguishable from silence at this layer.
Our recorder-history sample therefore measured value-change gaps, not physical Zigbee report cadence:
| Load behavior | Median power value-change gap | Longest observed gap |
|---|---|---|
| Three dynamic computer loads | 7.35–7.57 s | 8.36–23.09 s |
| Two stable computer loads | 69.27–97.44 s | 200.10–307.70 s |
This is one measured installation, not a universal plug specification. Plot last value-change age for honesty, but pair it with availability: a flat wattage line can mean a stable load or a silent source. Availability tells you whether Home Assistant still considers the entity present; neither signal alone proves a fresh physical measurement.
Before calling the setup lab-grade:
Design status: this adapter is a design sketch. It is not implemented or tested in this installation. The live system is read-only observation through Prometheus; no agent can actuate a plug.
The safe default is agent reads Prometheus and cannot actuate anything.
Home Assistant exposes authenticated state and service APIs.[5] If control is ever built, put a deterministic adapter between the agent and Home Assistant and give the model neither a Home Assistant token nor a direct service-call path.
Use three tiers:
| Tier | Capability | Default |
|---|---|---|
| Observe | Query Prometheus and Home Assistant state | enabled |
| Propose | Produce a structured action proposal | enabled |
| Act | Call a tiny allow-listed control adapter | disabled |
A real adapter must maintain an authoritative entity policy mapping; an unconnected list of blocked class names does not enforce anything. The policy must map each allowed entity to its verified load class and allowed actions.
The adapter should enforce:
turn_on or turn_off—never ambiguous toggle;The agent may propose an action, but it must not mint its own approval window. A proposal references an independently issued grant:
{
  "action": "turn_off",
  "entity_id": "switch.test_lamp",
  "reason": "power remained above the approved threshold for 10 minutes",
  "observed_watts": 63.4,
  "grant_id": "human-approval-20260805-001"
}
The adapter—not the agent—looks up the grant, verifies its entity, action, expiry, current state, and post-condition, then performs any service call. Keep telemetry and future control credentials separate for revocation hygiene, while remembering that ordinary Home Assistant bearer tokens are not intrinsically read-only.
Before editing, back up:
configuration.yaml;Rollback order:
The plugs and bridge should require no rollback because telemetry setup does not change them.