Muse Spark Open 816B on one GB300: 29 tok/s with 311 GiB of experts in Grace
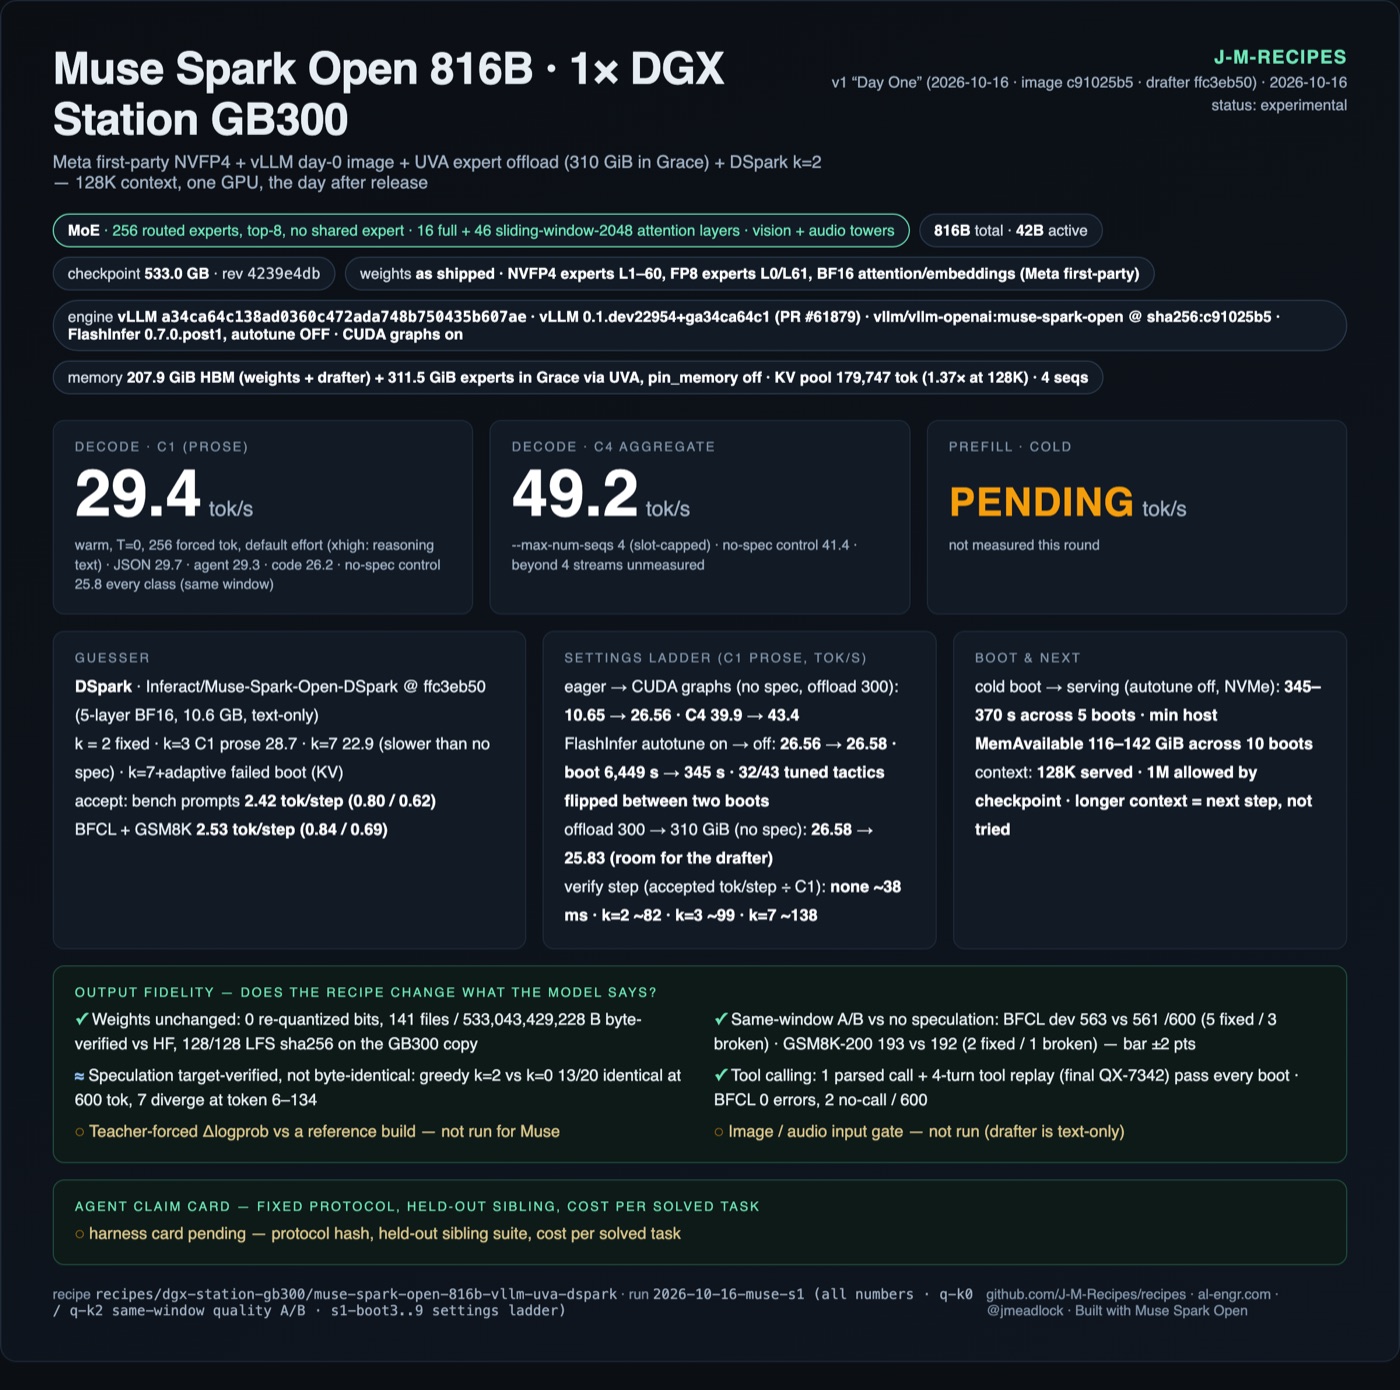
- How fast? 29.4 tok/s single-stream on prose (JSON 29.7, agent 29.3, code 26.2) and 49 tok/s total at 4 concurrent requests. Without speculation it’s 25.8 and 41.
- Is it the same model? On the two graded tests we ran, yes: BFCL tool calling 563 vs 561 out of 600 and GSM8K 193 vs 192 out of 200, against the same server with speculation off.
- Two lessons that travel. FlashInfer’s kernel autotune took 1 h 48 min per boot and bought nothing; with it off, boot is 6 minutes. And on a model whose experts live in CPU memory, short drafts win: guessing 7 tokens ahead was slower than not guessing at all.
Why it fits at all
Muse is a mixture-of-experts model: 62 layers, 256 experts per layer, 8 chosen per token. Almost all of the 496 GiB is expert weights (461 GiB). Any one token touches only a few percent of them, so the experts don’t all have to sit in fast GPU memory. vLLM’s UVA offload keeps the ones it can’t fit in the Grace CPU’s LPDDR5X and lets the GPU read them directly over the 900 GB/s C2C link.
Our sizing note before the download said park it. The offloaded weights have to be “pinned” host memory, and PyTorch rounds every pinned buffer up to a power of two. For ~300 GiB of experts that predicted a ~446 GiB peak on a box with 494, which is too close. vLLM has an escape hatch for exactly this: VLLM_WEIGHT_OFFLOADING_DISABLE_PIN_MEMORY=1 allocates the exact size. With it set, the lowest free host memory across ten boots was 116–142 GiB, and the watchdog we ran (kill the container below 24 GiB) never came close.
vllm/vllm-openai:muse-spark-open@sha256:c91025b5…   (TP1, one GB300)
-e VLLM_WEIGHT_OFFLOADING_DISABLE_PIN_MEMORY=1
--offload-backend uva --cpu-offload-gb 310 --cpu-offload-params experts
--max-model-len 131072 --max-num-seqs 4 --max-num-batched-tokens 8192 --gpu-memory-utilization 0.92
--kernel-config '{"enable_flashinfer_autotune":false}'
--speculative-config '{"method":"dspark","model":"<Muse-Spark-Open-DSpark>","num_speculative_tokens":2}'
--reasoning-parser muse --tool-call-parser muse --enable-auto-tool-choice
Same sizing note, other half: reading the offloaded experts per token over C2C put the ceiling at about 25–30 tok/s single-stream without speculation. It measured 25.8–26.6. When back-of-the-envelope bandwidth math lands like that, the box is doing what physics allows and the remaining levers are fewer bytes per token or more tokens per read.
The settings ladder
Every row is a fresh boot with gates (chat, tool call, a 4-turn tool conversation, greedy repeat), then single-stream (C1) on four prompt types and 4 concurrent streams (C4). T=0, 256 tokens per request.
| Boot | What changed | C1 prose | C1 code | C4 total | Boot time |
|---|---|---|---|---|---|
| 1 | Eager (no CUDA graphs), autotune on, 300 GiB offload | 10.6 | 10.6 | 39.9 | 6,510 s |
| 2 | CUDA graphs on | 26.6 | 26.6 | 43.4 | 6,449 s |
| 3 | Autotune off | 26.6 | 26.6 | 42.6 | 345 s |
| 4 | 310 GiB offload (room for the drafter), no spec | 25.8 | 25.8 | 41.4 | 346 s |
| 5 | DSpark k=7 | 22.9 | 21.2 | 37.8 | 6,490 s* |
| 6 | DSpark k=3 | 28.7 | 25.0 | 48.0 | 366 s |
| 7 | DSpark k=2 (the recipe) | 29.4 | 26.2 | 49.2 | 366 s |
* Boot 5 still had autotune on. Rows are re-ordered by setting, not by time; the exact boots and per-rep numbers are in the recipe’s results bundle. Rows 4 and 7 are the same-window pair the quality test used.
CUDA graphs were worth 2.5× single-stream but almost nothing at 4 streams. That shape says the eager boot was paying fixed per-step overhead (launching thousands of small kernels from Python), which graphs remove, while at 4 streams the step is already dominated by reading experts.
Lesson 1: autotune was noise here
FlashInfer tunes its MoE kernels at boot by timing each candidate “tactic” on every batch shape and keeping the fastest. On Muse, with most experts coming over C2C, the tuning pass took 1 h 42–43 min, every boot, even when the previous boot’s cache file loaded and its keys matched. The cache was found; the tuner just re-ran.
Comparing the cache after two boots explained why it didn’t matter: same 43 entries, identical metadata, and 32 of the 43 had picked a different tactic. When the timing is dominated by reads from CPU memory, the tactics are within noise of each other and the “winner” is a coin flip. Booting with autotune off gave the same speed (26.58 vs 26.56 tok/s) in 6 minutes instead of 108.
Lesson 2: on offloaded experts, short drafts win
Speculative decoding lets a small drafter guess the next few tokens so the big model can check them all in one step. Muse has a matching drafter, DSpark (5 layers, 10.6 GB). It is good at guessing: at k=7 it got 3.17 tokens accepted per step. And it made Muse slower.
| Draft length | Tokens per step | C1 prose | Cost of one step (approx.) |
|---|---|---|---|
| none | 1 | 25.8–26.6 | ~38 ms |
| k=2 | 2.42 | 29.4 | ~82 ms |
| k=3 | 2.85 | 28.7 | ~99 ms |
| k=7 | 3.17 | 22.9 | ~138 ms |
Step cost is tokens per step divided by tok/s. Checking 8 tokens costs about 3.7× checking one. Our explanation, not yet profiled: each extra token in the check gets routed to its own 8 experts per layer, so a wider step pulls in more distinct experts, and most of those come over C2C. On a model that lives entirely in HBM the check is nearly free and long drafts pay. Here every extra guess costs reads. On DeepSeek-V4.1-Flash on this same box, a 5-token draft was measured fetching 3.7× more distinct experts per step; same mechanism.
Code is the exception: k=2 buys nothing there (26.2 vs 25.8) and k=3 loses. We also tried vLLM’s adaptive verification at k=7, which trims weak guesses before checking them. It didn’t boot: its startup profiling left 10.2 GiB for the KV cache, short of the 12.5 GiB one 128K request needs.
Is k=2 the same model?
Speculation is supposed to be lossless, because the big model checks every token. In practice the check runs a different batch shape, so the arithmetic rounds slightly differently and greedy output can drift apart. So we tested it: two boots in one window, identical except for the drafter, each running the same evals.
| Test | No spec | DSpark k=2 |
|---|---|---|
| BFCL v4 simple_python + multiple (600, our grader, low reasoning effort) | 561 (93.5%) | 563 (93.8%): 5 fixed, 3 broken |
| GSM8K, first 200 test problems | 192 (96.0%) | 193 (96.5%): 2 fixed, 1 broken |
| Greedy output, 20 prompts × 600 tokens | — | 13/20 identical; 7 diverge at token 6–134 |
| BFCL wall time | 3,521 s | 2,852 s (−19%) |
The flips go both ways and are the size of noise. Our bar was ±2 points on both tests and k=2 is inside it. So k=2 is level with no speculation and faster, and it’s now Muse’s default on this box. On real tool-call and math traffic the drafter averaged 2.53 tokens per step.
What this is not
- Not a model review. BFCL here is our own grader, comparing two servers on one box, and GSM8K is 200 problems.
- The speed rows decode reasoning text. Muse’s chat template defaults to its highest reasoning effort, so the 256 timed tokens are the start of the model’s reasoning, not the answer. That’s why every prompt type reads the same with no drafter.
- No logprob gate. We judged k=2 on graded tests, not on token-level agreement with a reference build.
- Text only. The drafter doesn’t see image embeddings, and we didn’t test image or audio input.
- Preview engine. The vLLM image carries Muse support from a pull request that hadn’t merged when we tested. We’ll re-gate on the first tagged release.
Next
Longer context. The checkpoint allows 1,048,576 tokens; we served 128K. The KV cache today holds 179,747 tokens with the drafter (1.37× one 128K request) and 342,996 without it. Finding out how far this lane stretches, and what it costs in offload and speed, is the next experiment.